chromixs
Manual
The following sections briefly describe the methods implemented in the graphical application CHROMIXS, and how to start CHROMIXS from the command-line and the platform Application Menu. It further provides step-by-step descriptions of the operations available in chromixs.
Introduction
The CHROMIXS program loads and plots a set of experimental SAXS data frames produced by a Size Exclusion Chromatography (SEC) run with online SAXS data collection. Frames are represented with respect to elution time, allowing the user to select buffer and sample regions and perform background subtractions. Multiple buffer and sample regions can be selected to compare the resulting subtractions. The current state of these selections, including all plot configurations, can be saved to a project file and restored later.
Running chromixs
Usage:
$> chromixs [DATA]
CHROMIXS accepts absolute as well as relative paths to either a CHROMIXS project file or a list of experimental SAS data (.dat) files. If present, the GUI will be started and the project or data will be loaded directly.
If neither a project file nor a path to experimental data is provided, CHROMIXS will start the GUI without loading any data.
The OPTIONS known by CHROMIXS are described in the next section.
Command-Line Arguments and Options
Application Menu
Graphical User Interface
Main Window
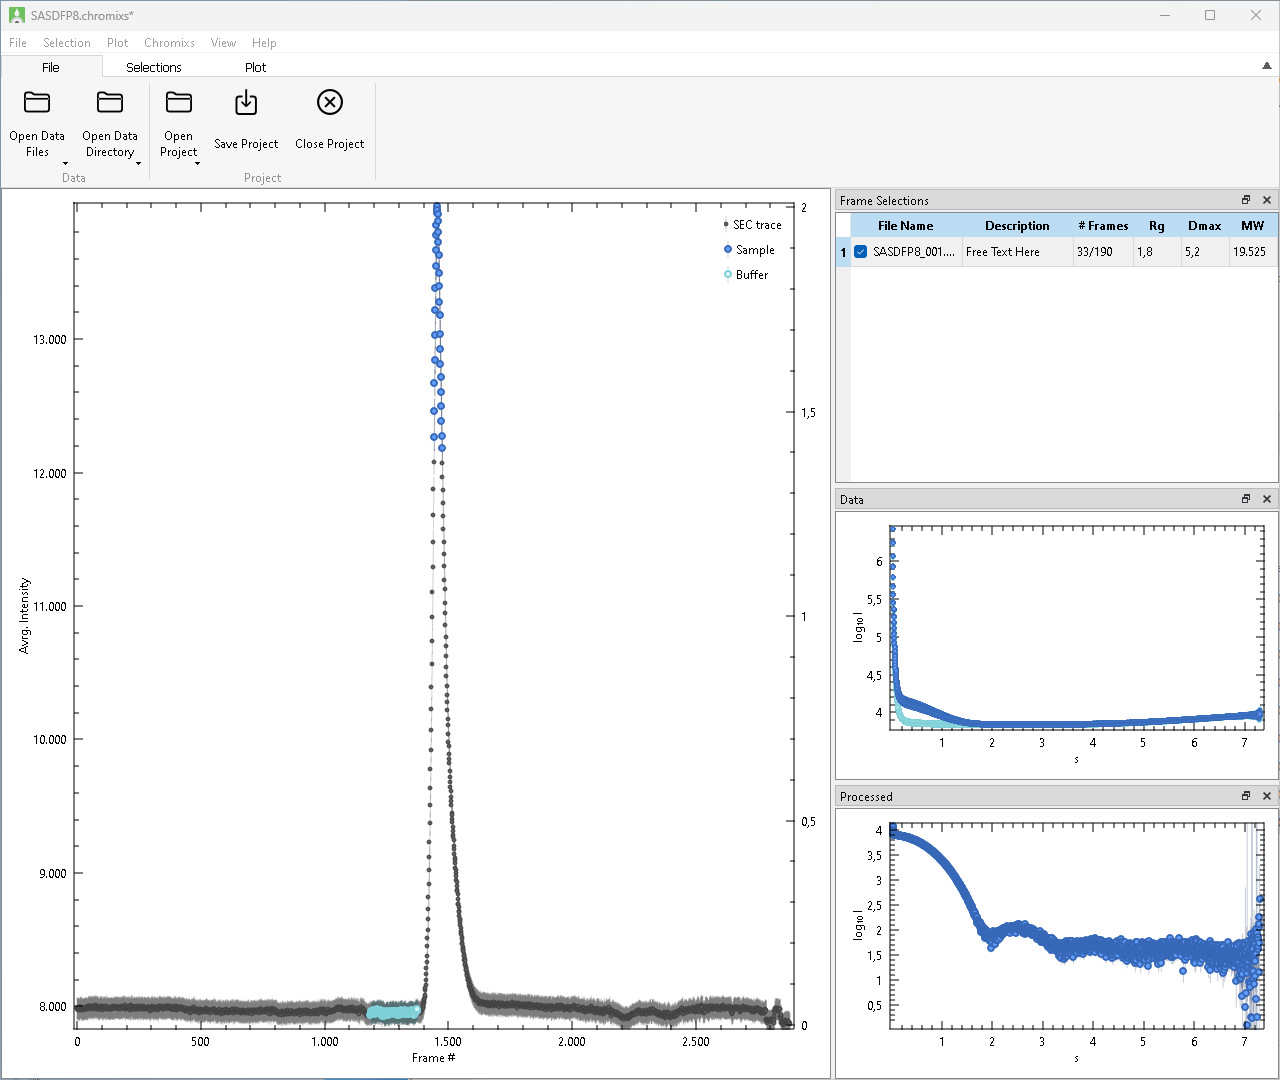
The graphical user interface of CHROMIXS consists of the following components:
As usual, Menus and Toolbars provide quick access to all Operations implemented in CHROMIXS. They are situated at the top of the Window, while the Central Area depicts the plot of the SEC trace, as well as provides multiple detachable docks windows with supplementing information (Frame Selections, Data, Processed).
See the following sections for details on each of these components.
Menus
File Menu
- Open Data File
- Recent Data File …
- Recent Data Directory …
- Open Project
- Recent Projects …
- Save Project
- Save Project As …
- Close Project
- Package Project
Selection Menu
- Add Automatic Frame Selections
- Add Frame Selection
- Duplicate Current Frame Selection
- Remove Frame Selection
- Remove All Frame Selections
- Sample Frames
- Buffer Frames
- Remove Frames
- Move
- Zoom
- Calculate Structural Parameters
- Process Frame Selection
- Evolving Factor Analysis
- Open Processed data in PRIMUS
Plot Menu
Chromixs menu
- Configure (Windows, Linux)
- Preferences (macOS)
View Menu
- Frame Selections
- Data
- Processed
- Toolbar
Toolbars
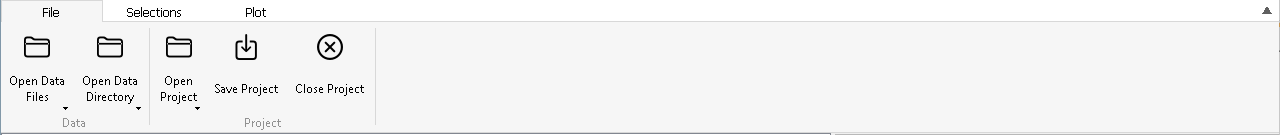
File Toolbar
Selections Toolbar
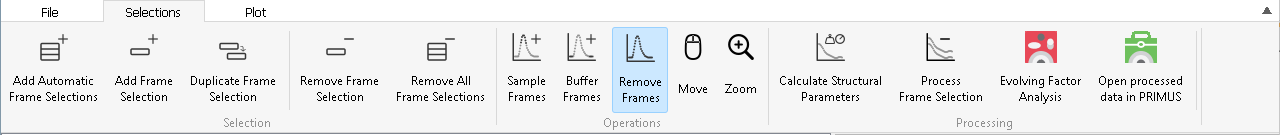
- Add Automatic Frame Selections
- Add Frame Selection
- Duplicate Current Frame Selection
- Remove Frame Selection
- Remove All Frame Selections
- Sample Frames
- Buffer Frames
- Remove Frames
- Move
- Zoom
- Calculate Structural Parameters
- Process Frame Selection
- Evolving Factor Analysis
- Open Processed data in PRIMUS
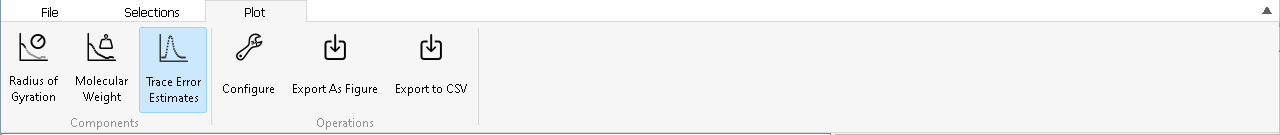
Plot Toolbar
Central Area
The Central Area of CHROMIXS is covered by the Trace Plot and three movable side windows for the Frame Selections, selected Data and the Processed frames.
Trace Plot
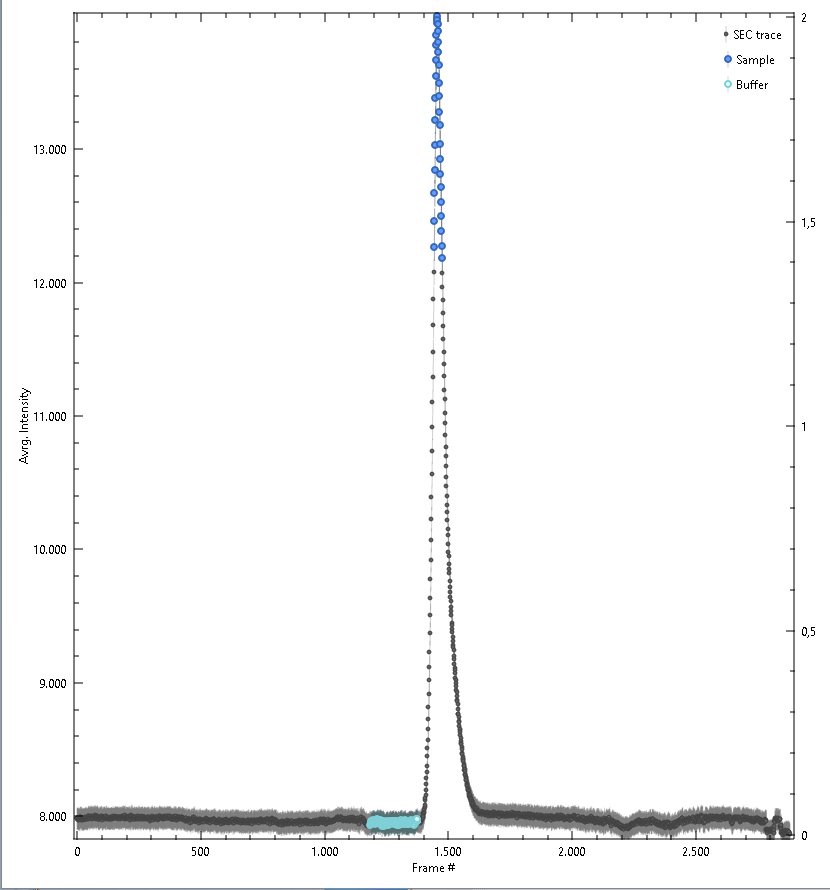
After loading experimental data individually or from a directory, the integrated SAXS intensities, the trace, is shown in this window. Trace values and error estimates are calculated as:
\[I_{\text{trace}}\left(s\right) = \frac{1}{n} \sum_{s=s_{\min}}^{s_{\max}} I(s)\] \[\sigma\left({I_{\text{trace}}}\left(s\right)\right) = \sqrt{ \frac{1}{n} \sum_{s=s_{\min}}^{s_{\max}} \sigma\left(I(s)\right)^2}\]The integration range \(s_{\min}\) to \(s_{\max}\) used atfor these steps may be changed in the Settings.
Further, all Frame Selections will be done within the plot area, and shown as as colored regions in this plot. Point-wise Trace Error Estimates, may be shown or hidden. After calculating structural parameters point-wise Radius of Gyration and Molecular Weight values may be shown or hidden as well.
Colors assigned in this plot are propagated to the Data and Processed plots.
Frame Selections
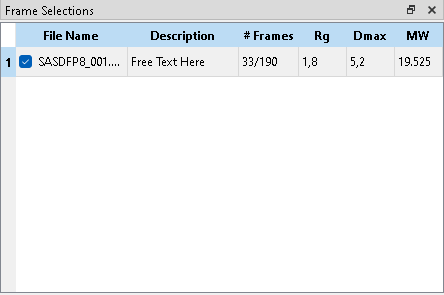
A “Frame Selection” describes a set of buffer and sample frames together with the Processed, i.e. subtracted data. Multiple frame selections can be active in parallel, for example to describe traces with multiple peaks or to compare the effect of different buffer regions with the sample sample range. Any frames may be included in multiple selections.
New selections can be added automatically or manually. Existing subtractions can be duplicated, cleared or removed entirely. Checked frame selections are shown on the trace plot with colored markers and may be modified (e.g. add/remove frames), unchecked frame selections are hidden in the trace plot and can not be modified.
Only the currently highlighted frame selection can be modified by adding or removing Buffer Frames or Sample Frames. The “Frames” column indicates the number of selected sample and buffer frames.
On Process Frame Selection, the currently highlighted Frame Selection is used to calculate the subtraction. The resulting data file is shown in the Processed window. Radius of Gyration (Rg), Maximum Diameter (Dmax) and Molecular Weight (MW) are estimated via AUTORG, DATGNOM, and DATMW respectively. Rg and Dmax are in units of the data, MW in Dalton. The “Description” field is a free text field, its value is included in the header of the subtracted file.
Context Menu on Right Click on Selections
- Duplicate Frame Selection
- Remove Frame Selection
- Open Sample frames in PRIMUS
- Open Buffer frames in PRIMUS
- Clear Frames
- Copy File Location
Context Menu on Right Click in Empty Space
Data
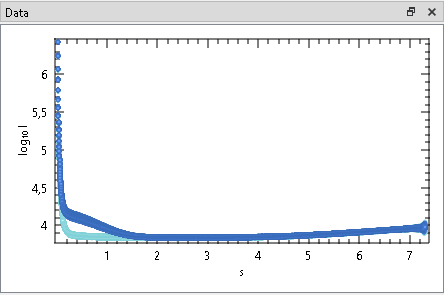
This Window shows the selected frames of currently checked Frame Selections.
Check or uncheck a Frame Selections to show or hide the corresponding data frames. All selected data frames of all checked Frame Selections are shown in dark-grey. Further, the data of the currently highlighted selection is shown with the same colors as in the Trace Plot and raised for improved visibility.
Processed
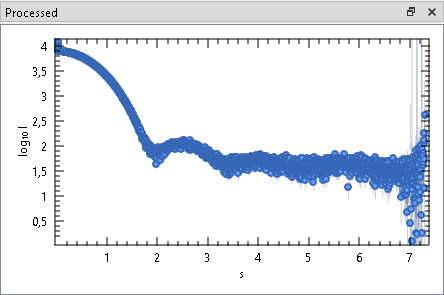
This Window shows the processed data frames after subtracting the averaged buffer frames from individual sample frames. After changing a frame selection, the processed frame has to re-calculated manually.
Check or uncheck a Frame Selections to show or hide the corresponding processed frames. By default, assigned data colors match the sample selection colors in the trace plot.
Settings
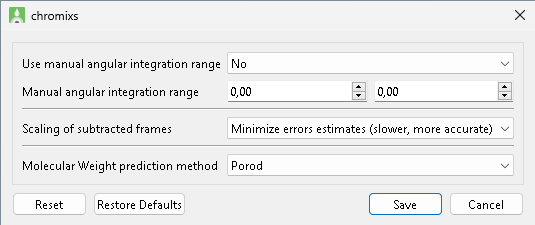
| Options | Description |
|---|---|
| Use manual angular integration range | Enabled/disable manual angular integration range. Defaule: disabled. |
| Manual angular integration range | Angular range to be used for integration of scattering data for the Trace Plot. Default: [0.1;0.8] \(\text{nm}^{-1}\) or [0.01;0.08] \(\AA^{-1}\), respectively, depending on data units. |
| Scaling of subtracted frames | TODO |
| Molecular Weight prediction method | Molecular Weight calculation Method used by DATMW to Calculate Structural Parameters. Default: Porod. |
Wizards
Operations
This section list and describes all operations that are available in chromixs in alphanumerical order. Other sections of this manual refer to these descriptions.
Add Automatic Frame Selections
| Accessibility | Icon | Shortcut | Description |
|---|---|---|---|
| Menu, Toolbar |
Add Frame Selection
| Accessibility | Icon | Shortcut | Description |
|---|---|---|---|
| Menu, Toolbar |
Buffer Frames
| Accessibility | Icon | Shortcut | Description |
|---|---|---|---|
| Menu, Toolbar |
Calculate Structural Parameters
| Accessibility | Icon | Shortcut | Description |
|---|---|---|---|
| Menu, Toolbar |
TODO: mention settings
Clear Frames
| Accessibility | Icon | Shortcut | Description |
|---|---|---|---|
| Context Menu |
Close Project
| Accessibility | Icon | Shortcut | Description |
|---|---|---|---|
| Menu, Toolbar | Ctrl+W, ⌘+W | May prompt to save the project. Then removes all data files, selections and processed files from the GUI. |
Configure
| Accessibility | Icon | Shortcut | Description |
|---|---|---|---|
| Menu, Toolbar | Open the plot configuration for the trace plot. |
TODO: link context menu
Copy File Location
| Accessibility | Icon | Shortcut | Description |
|---|---|---|---|
| Context Menu | Copies the full path of the processed file to the clipboard. |
Duplicate Current Frame Selection
| Accessibility | Icon | Shortcut | Description |
|---|---|---|---|
| Context Menu | Creates a new Frame Selection, and copies the current selection. |
Evolving Factor Analysis
| Accessibility | Icon | Shortcut | Description |
|---|---|---|---|
| Menu, Toolbar | Starts the Evolving Factor Analysis wiazrd. |
Export As Figure
| Accessibility | Icon | Shortcut | Description |
|---|---|---|---|
| Menu, Toolbar | Export the current Trace Plot as figure in SVG, PNG, TIFF or PDF format. |
Export to CSV
| Accessibility | Icon | Shortcut | Description |
|---|---|---|---|
| Menu, Toolbar | Export the current Trace Plot as CSV. Columns are: Frame index, Trace, Trace errors, sample selection, … |
TODO: check column order.
Molecular Weight
| Accessibility | Icon | Shortcut | Description |
|---|---|---|---|
| Menu, Toolbar | Show or hide the frame-wise Radius of Gyration for the currently checked Frame Selections. Requires to Calculate Structural Parameters for each row beforehand. |
Move
| Accessibility | Icon | Shortcut | Description |
|---|---|---|---|
| Menu, Toolbar |
Open Buffer frames in PRIMUS
| Accessibility | Icon | Shortcut | Description |
|---|---|---|---|
| Context Menu | Open the currently selected buffer frames in PRIMUS. |
Open Data Directory
| Accessibility | Icon | Shortcut | Description |
|---|---|---|---|
| Toolbar | Opens all experimental SAS data (.dat) files present in the selected directory. Files are opened, and new data points appended to the SEC trace in lexicographical order of their file names. |
Open Data File
| Accessibility | Icon | Shortcut | Description |
|---|---|---|---|
| Menu, Toolbar | Ctrl+O, ⌘+O | Opens one or more experimental SAS data (.dat) file and appends a new data point at the end of the current SEC trace. The user has to ensure to open files in temporal order. |
Open Processed data in PRIMUS
| Accessibility | Icon | Shortcut | Description |
|---|---|---|---|
| Menu, Toolbar |
TODO: all? currently checked ones? only current one?
Open Project
| Accessibility | Icon | Shortcut | Description |
|---|---|---|---|
| Menu, Toolbar | Opens a named project file. All previously opened data files will be reloaded and previous frame selections will be restored. |
Open Sample frames in PRIMUS
| Accessibility | Icon | Shortcut | Description |
|---|---|---|---|
| Context Menu | Open the currently selected sample frames in PRIMUS. |
Package Project
| Accessibility | Icon | Shortcut | Description |
|---|---|---|---|
| Menu | Packages the current project into a ZIP archive. The generated ZIP archive contains all data files as well as a project file where all paths point to the data in the archive. Particularly useful for archival of finished projects, data exchange and collaboration. |
Process Frame Selection
| Accessibility | Icon | Shortcut | Description |
|---|---|---|---|
| Menu, Toolbar |
Radius of Gyration
| Accessibility | Icon | Shortcut | Description |
|---|---|---|---|
| Menu, Toolbar | Show or hide the frame-wise Radius of Gyration for the currently checked Frame Selections. Requires to Calculate Structural Parameters beforehand. |
Recent Data Directory
| Accessibility | Icon | Shortcut | Description |
|---|---|---|---|
| Menu |
Recent Data File
| Accessibility | Icon | Shortcut | Description |
|---|---|---|---|
| Menu |
Recent Projects
| Accessibility | Icon | Shortcut | Description |
|---|---|---|---|
| Menu |
Remove All Frame Selections
| Accessibility | Icon | Shortcut | Description |
|---|---|---|---|
| Menu, Toolbar |
Remove Frame Selection
| Accessibility | Icon | Shortcut | Description |
|---|---|---|---|
| Menu, Toolbar |
Remove Frames
| Accessibility | Icon | Shortcut | Description |
|---|---|---|---|
| Menu, Toolbar |
Sample Frames
| Accessibility | Icon | Shortcut | Description |
|---|---|---|---|
| Menu, Toolbar |
Save Project
| Accessibility | Icon | Shortcut | Description |
|---|---|---|---|
| Menu, Toolbar | Ctrl+S, ⌘+S | Saves the current state to a project file. The current plot configuration, paths to all openend data files and the current frame selection are saved. If no project file was specified, a new project file can be created. |
Save Project As
| Accessibility | Icon | Shortcut | Description |
|---|---|---|---|
| Menu, Toolbar | Shift+Ctrl+S, ⇧+⌘+S |
Trace Error Estimates
| Accessibility | Icon | Shortcut | Description |
|---|---|---|---|
| Menu, Toolbar | Show or hide trace error estimates. See Trace Plot for details. |
Zoom
| Accessibility | Icon | Shortcut | Description |
|---|---|---|---|
| Menu, Toolbar |
Tutorial
Quick Start
Users familiar with CHROMIXS versions prior to ATSAS-4.0 may follow this quick start guide:
- File Toolbar -> Open Data Directory
- File Toolbar -> Save Project
- Selections ToolBar -> Add Frame Selection
- Selections ToolBar -> Sample Frames
- use mouse or touchpad to select sample frames
- Selections ToolBar -> Buffer Frames
- use mouse or touchpad to select buffer frames
- Selections ToolBar -> Process Frame Selection
- right-click the Frame Selection -> Open Processed Data in PRIMUS