gnomplot
Manual
The following sections describe the purpose of GNOMPLOT, the file formats it reads, and the quantities displayed in the graphical interface.
Introduction
GNOMPLOT, is a lightweight viewer for regularised SAS data (.out) files.
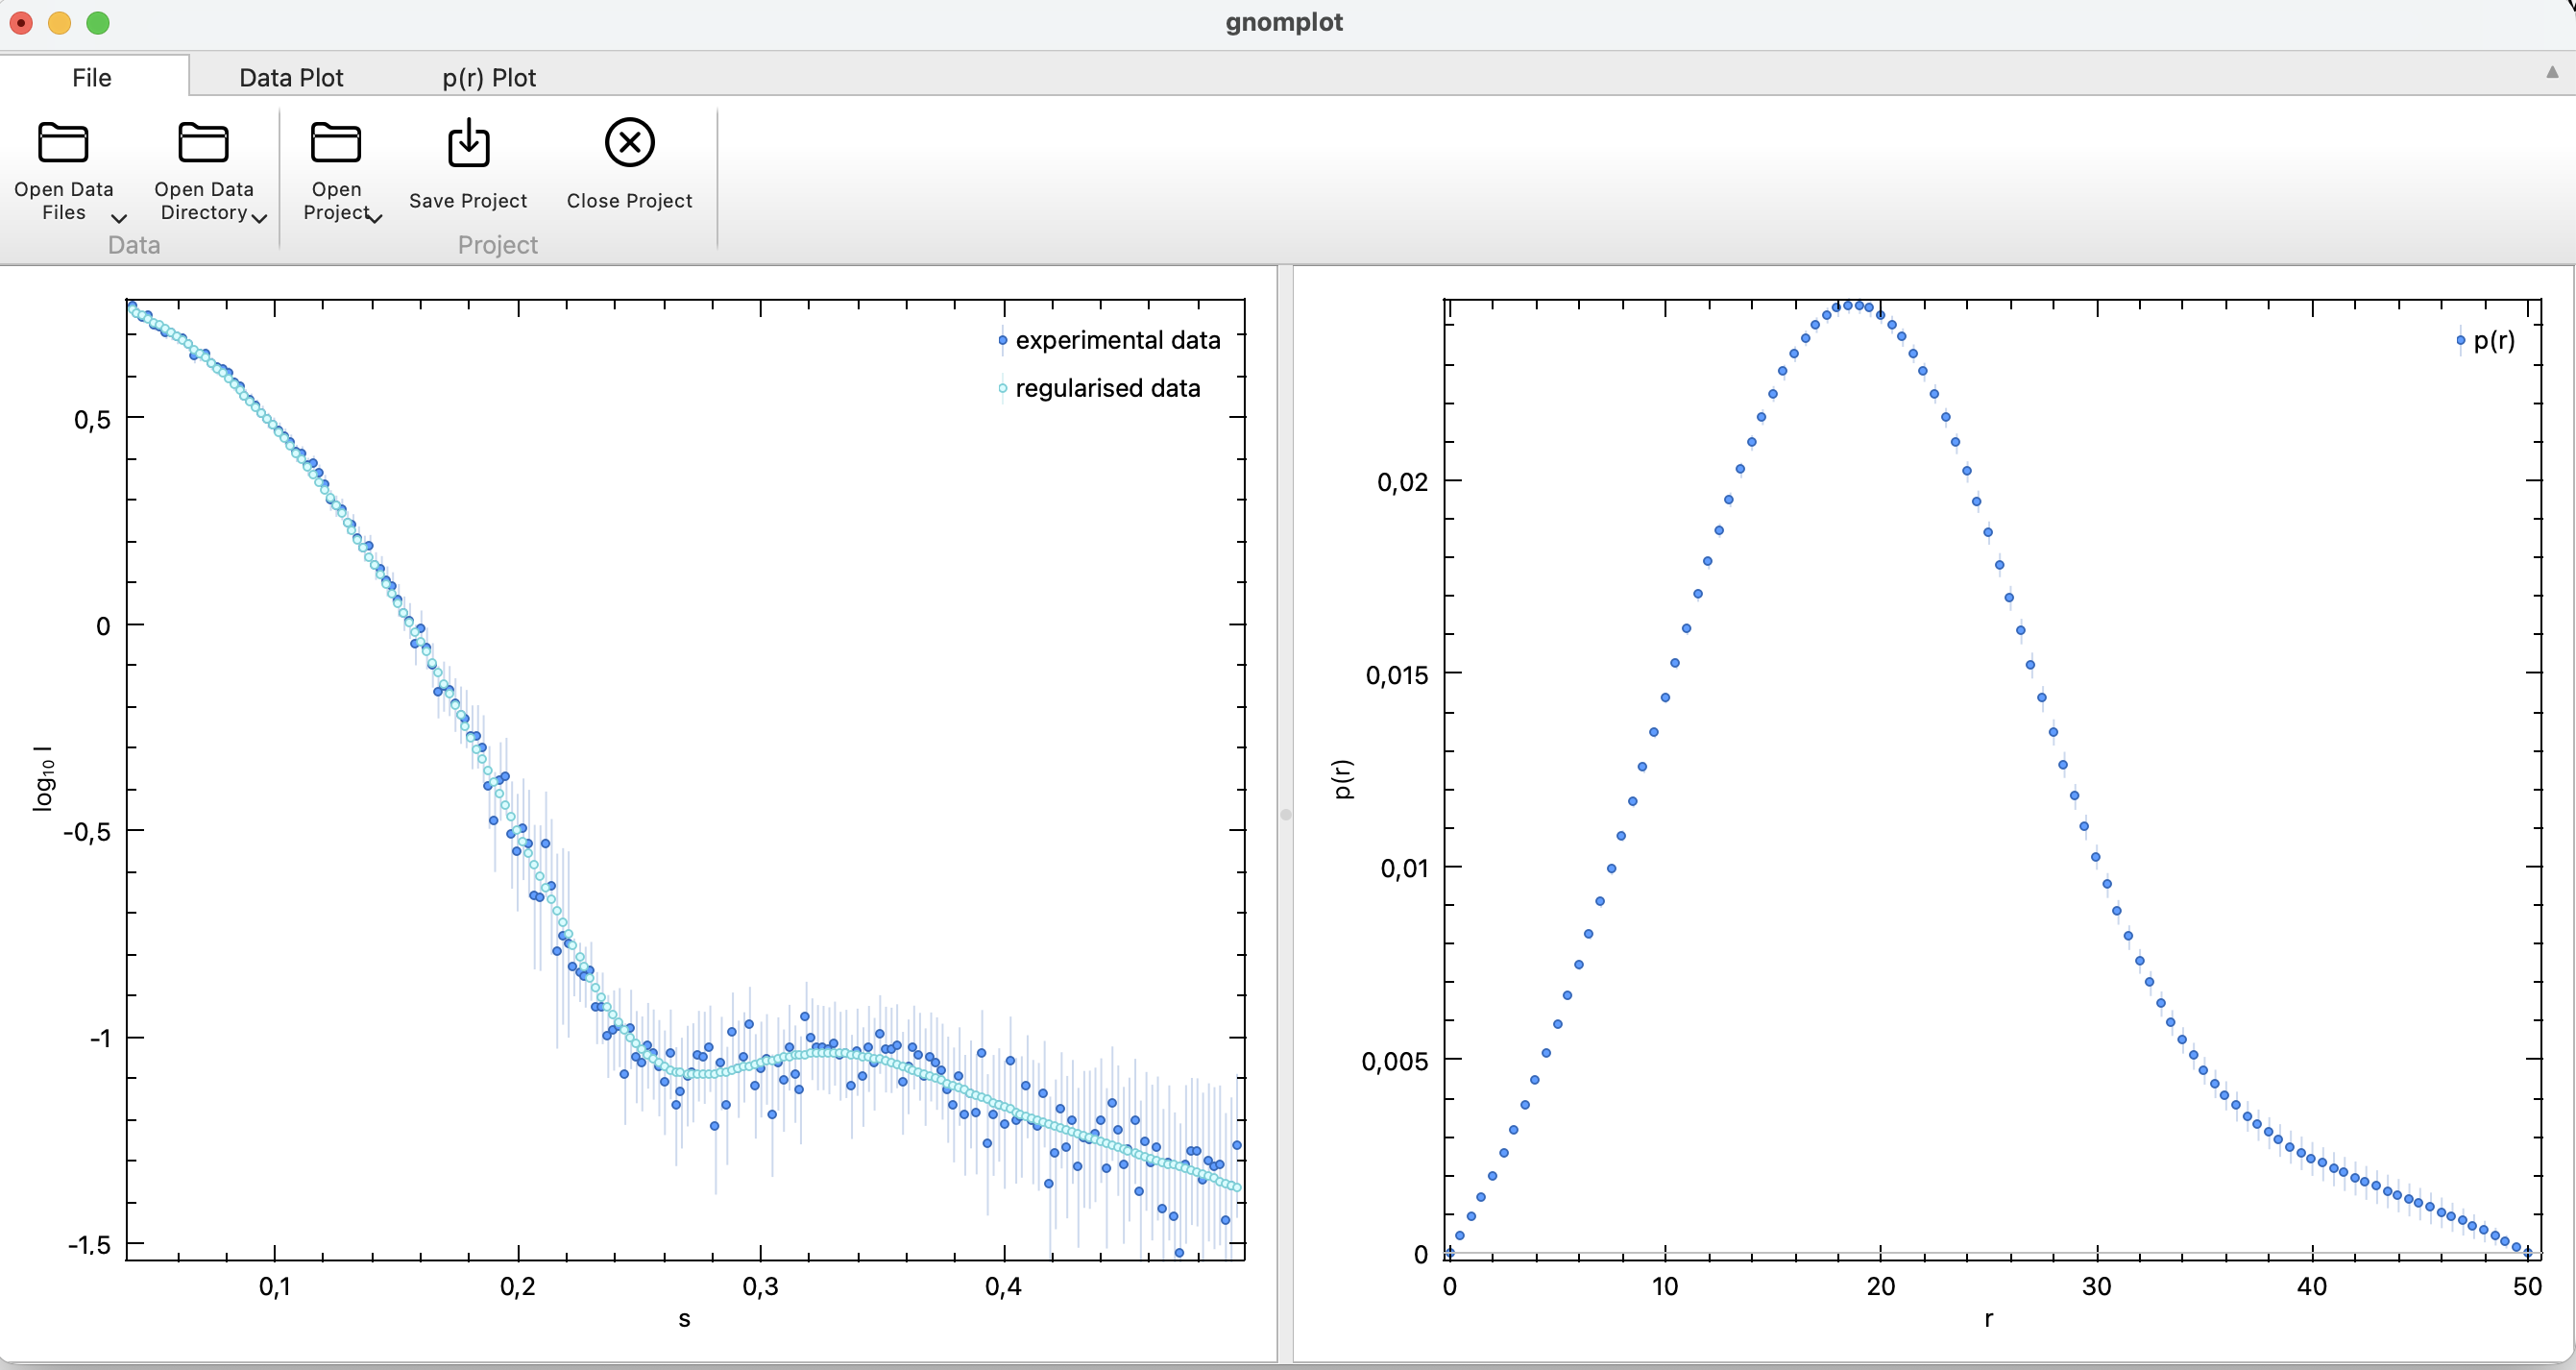
It displays the data present in the regularised SAS data (.out) file, experimental data, together with smeared and desmeared curves on the left and the distance distribution function \(p(r)\) on the right. No other quantities are displayed.
One or more files may be viewed simultaneously, the state of GNOMPLOT may be saved as project.
All plot features are supported on both plot panels.
Running gnomplot
Working with Data
GNOMPLOT displays one or more regularised SAS data (.out) files as created by DATGNOM or GNOM.
- To load a data files individually: File -> Open Data File. This adds the selected data to the current project.
- To load all data files in a directory: File -> Open Data Directory.
Working with Projects
Projects contain information about loaded data and all plot configurations done previously. There can be only one project open at a time, but each project may contain more than one data file.
GNOMPLOT starts with an empty project and adds loaded data files to it.
- To load a previously saved project: File -> Open Project. Loading a new project replaces the current project.
- To save the current application state: File -> Save Project. If no project is currently active, it is saved to a new project file.
- To save the project in a new file: File -> Save Project As.
- To close the current Project: File -> Close Project. Closing a project removes all data from all plots.
- To package a project to a self-contained .zip archive: File -> Package Project